Varuna Jayasiri

Programmer

Read this first

Shared memory with node.js

This is more like a tutorial on writing a simple node.js add-on to share memory among node.js processes.

One of the limitations of node.js/io.js is that they are single threaded. Only way to use multiple cores in the processor is to run multiple processes [1]. But then you are working on different memory spaces. So it doesn’t help if you want multiple processes working on the same memory block. This is required in memory intensive tasks that cannot be efficiently sharded.

All the source code is available in Github.

Node addon

You need node-gyp installed to build the node module.

npm install node-gyp -g

I think the node.js version matters as the addon api has changed. I was working on node 0.12.2, when I tested this out.

binding.gyp is required by node-gyp to build the addon.

Then comes shm_addon.cpp. This is a very basic addon that has one export createSHM, which creates a...

Continue reading →


Lessons learned: Getting the first B2B customer

It took Forestpin almost 2 years to get its first big customer. Making the first sale is always hard. It was a tough ride; talking to a lot of potential customers, changing product strategy from time to time, taking up classes on pitching and of course a lot of programming. We learned a lot during the process.

Beginning

We started off in March 2012, with a meeting of a few of guys. Some of whom believed that there is a lack of tools to find fraud and irregularities in financial transactions.

The idea was to develop financial data analytics software to highlight anomalies.

First couple of months were spent on research. We talked to auditors, accountants and managers to see if they had the problem we were trying to solve. We also discussed solutions they were using to solve it.

Before starting on the product, we implemented a bunch of analyses to highlight anomalies in payments data...

Continue reading →


Black or White

Which background is better? Most text editors and document readers have light backgrounds. But there’s a lot of programmers who use dark backgrounds. And there are a some analytics and dashboard applications with dark backgrounds.

Dark background - WIP

Stephan Few has criticized using dark backgrounds for dashboards in his book Information Dashboard Design, citing an image of Roambi. By the way, Roambi later moved to a white background and then brought back the option of dark backgrounds.

Have you noticed that many business intelligence (BI) software companies have introduced black screens as the standard for mobile devices? Is this because mobile devices work better with black screens? If you look for the research, as I have, it isn’t likely that you’ll find any.

No one seems to question the efficacy of light backgrounds for reading text. Why the difference? Text and graphics both involve objects that...

Continue reading →


SEO Crap

SEO is dead - at least much different from what it was known to be. But there are a plenty of consultants who market SEO, as if it is something that is hard to get right. Many organizations fall for it.

Search engines do not want to show web sites with some special SEO sauce to be on top. They want websites that people look for.

There were days when you could use neat little tricks (link farms, etc) to go higher on search results. This was possible because it is hard for an algorithm to figure out what’s better content. Now search engine algorithms have gotten better and they don’t fall for these tricks.

Yet I knew from experience that the real secret to SEO was not about tricks but about making your site the best it could be for your users while keeping the search engines in mind. It was true when I started doing SEO and it’s true now. Doing that always, always, always works to...

Continue reading →


2-10X faster frame rates with transform:matrix3d over top/left

When animating/moving HTML elements, setting their position with -webkit-transform: matrix3d() gives two to ten times faster frame rates compared to top/left or -webkit-transform: matrix(). On mobile devices you can observe native app like performance with transform: matrix3d.

Demo

http://bl.ocks.org/vpj/c5468e4593319009320e

It moves a panel that contains 10,000 div elements. On my macbook air running chrome, transform:matrix3d gives 30 - 40 fps while position:top/left and transform:matrix gives 10-15 fps. You can check the frame rate by selecting Show FPS meter on Rendering tab of chrome developer tools.

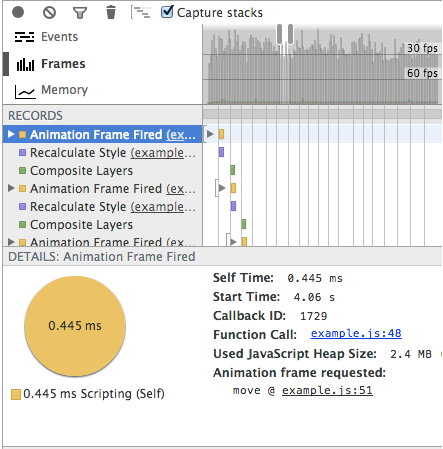
The following image shows snapshot of frames timeline with top/left.
Timeline for top/left

This is the snapshot of frames timeline with transform:matrix3d.
Timeline for transform:matrix3d

transform: matrix3d takes out the paint operation which gives increased frame.

The 3d translation layers offer a way of pre-blitting all the...

Continue reading →


Weya.coffee

Weya.coffee is a lightweight library with no dependencies to generate DOM elements. We developed it to replace Coffeecup as a client side template engine. Because of its simplicity and performance, we are also using Weya to replace DOM manipulation of d3.js in data visualizations.

Links

  • JsPerf - http://jsperf.com/weya-jquery-d3-coffeecup
  • Github - https://github.com/vpj/weya
  • Example bar chart - http://bl.ocks.org/vpj/9636655

Here’s a small example to show the usage.

userElems = []
Weya container, ->
 @div ".users", ->
  for user, i in users
   userDiv = @div '.user', on: {click: editUser}, ->
    name = @span ".name", user.name
    @span ".phone", user.phone
    if v.image?
     @img src: user.image

   userDiv.userId = i
   userElems.push user: user, name: name

The above code creates a list of users. It binds the data to the dom element userDiv.userId = i and also keeps track...

Continue reading →


People who are really serious about software should at least write their own libraries

We have been using a lot of tools and libraries in our software, and have replaced a number of them with our code. Libraries makes it easy to get things done, and to ship early. But from my experience, having a third-party library or a tool dominate a core part of your software is not a good idea.

People who are really serious about software should make their own hardware. - Alan Kay

We have moved away from a number of libraries (and frameworks and platforms) over the last couple of years. This may sound like a lot of hate, but it is not so. We still love those libraries and use them on a lot of smaller projects. But when your product grows and you want to mold it the way you want, sometimes libraries stand in your way. Some of the decisions we made could be wrong because we didn’t understand the library properly. But we spent a lot of time trying to stick to those libraries before...

Continue reading →


We stopped advertising on Facebook

Or, How to get Facebook “likes”? We (nearby.lk) stopped advertising on Facebook to get Facebook “likes”, because we felt that it was a giant fruitless scheme of making Facebook rich. Most of the “likes” on Facebook are useless, they are basically random clicks, which adds no value to anybody, and you need to pay Facebook for that. By the way, this may not be the case with advertising for Clicks to Website, Website Conversions, etc. - I don’t have experience with those.

We got on Facebook when one of our employees created a fan page for the company, which we later made our official page. Facebook advertising was important for us to get awareness and to build reputation - so that our clients know we are popular because a lot of people like us on Facebook.

It didn’t take us long to realize that the first goal is never met because we got almost no traffic to nearby.lk from Facebook; it was...

Continue reading →


Coffeescript helpers for d3.js

fp.js is a tiny library to help keep d3.js dom manipulation code clean.

Update (December 29, 2013)

Upgraded to support the format at the bottom. Check out this rewrite of the d3.js Grouped Bar Chart Example using fp.js.

I write a lot of d3.js code and most dom manipulation code got complicated and hard to maintain. With fp.js attributes, styles and events can be set easily. But the most important fact is that FP.js lets you maintain indentation in coffescript code that matches the dom structure.

numbers = [5, 3, 23, 6, 7, 0, 1, 25, 11, 19, 20]
chartHeight = 300

chart = d3.select("body")
 .append("svg")
 .attr("width", "100%")
 .attr("height", "100%")

bars = chart.selectAll("g.bar").data(numbers).enter()
 .append("g")
 .attr("class", "bar")

bars.append("rect")
 .attr("y", (d) -> chartHeight - d * 10)
 .attr("x", (d, i) -> i * 20)
 .attr("width", 20)
 .attr("height", (d) -> d * 10)
...

Continue reading →


Visualizing Numerical Lists

Underline doesn’t take away space in a table or a list of data and by varying the length of the underline you can help readers scan much faster and get an idea of the data and its distribution without having to read each number.

Here’s a number of alternatives to display a list of numbers. We have evaluated them in terms of,

  1. Reading an individual number
  2. Finding the largest and smallest
  3. Getting an idea about the distribution

Sorting is the best solution. But it can only be done with a single column list. The following approaches are for multi-column lists where the list is sorted by a different column (different from the column we are trying to visualize).

List

The simplest and often the best way to show a list of number is to simply list them.

[Forestpin Lite](//vpj.github.io/images/posts/underline/list.png)

However, if the reader is to find the largest value she might have to...

Continue reading →